
Claromers® Fight Epstein-Barr Virus
A Breakthrough in the Fight Against the Silent Pandemic
The Epstein-Barr virus (EBV), also known as human herpesvirus 4, is one of the most common and elusive viral infections in the world. It is responsible for infectious mononucleosis ("mono") and is associated with a range of chronic and autoimmune conditions—including Multiple Sclerosis, certain cancers, lupus, rheumatoid arthritis, and Irritable Bowel Disease. Estimates show that nearly 95% of the global population carry EBV for life.
For decades, EBV has remained dormant and unpredictable, persisting in the body and evading both treatments and immunity. Modern antiviral therapies, like acyclovir, have proven ineffective at stopping EBV’s long-term incubation—leaving billions at risk.
“Epstein-Barr is the quietest and most widespread pandemic in human history—it lives inside 95 percent of us for life, and modern medicine has never had a real tool against it… These results are the first sign that Maxwell’s Claromer technology may finally be that tool.” — Scotch McClure, Founder & CEO
Immune-Inspired Solutions: Claromers®
At Maxwell Biosciences, we believe tackling the world’s most persistent infections requires a new way of thinking. Our novel Claromer® platform—immune-inspired, broad-spectrum small molecules—mimics and enhances the body’s natural defenses, destroying pathogens without harming healthy cells or the microbiome.
In a recent third-party laboratory study, Claromers® demonstrated groundbreaking results against the Epstein-Barr virus.
Two Claromer® compounds achieved over 50% inhibition of EBV growth at non-toxic concentrations, compared to acyclovir, which showed no measurable effect.
The potential for an oral health product like a mouth rinse or toothpaste to interrupt EBV transmission could be transformative for public health—possibly representing the first real tool against this silent and widespread pandemic.
What’s Next?
This promising preclinical data propels us one step closer to:
Preventing the spread of EBV in the population
Potentially targeting and eradicating dormant EBV in the body
Delivering safe, affordable and shelf-stable solutions for global health
Developing Claromer®-based consumer and clinical products, starting with oral hygiene innovations and progressing to treatments that may directly address EBV’s hidden reservoirs in the body.
Read the full press release: Maxwell Biosciences’ Claromers Destroy Epstein-Barr.
Partner With Us
Maxwell Biosciences is actively seeking sponsorships, strategic partnerships and funding opportunities to create a therapeutic for Epstein-Barr virus and other challenging pathogens. Together, we can build a healthier future.
Contact us at partnerships@maxwellbiosciences.com.
Maxwell Biosciences—delivering immune-inspired solutions for a healthier planet.
EPSTEIN-BARR STUDY RESULTS
Milestone 1: Cytotoxicity Testing
Milestone 2: Antiviral Testing
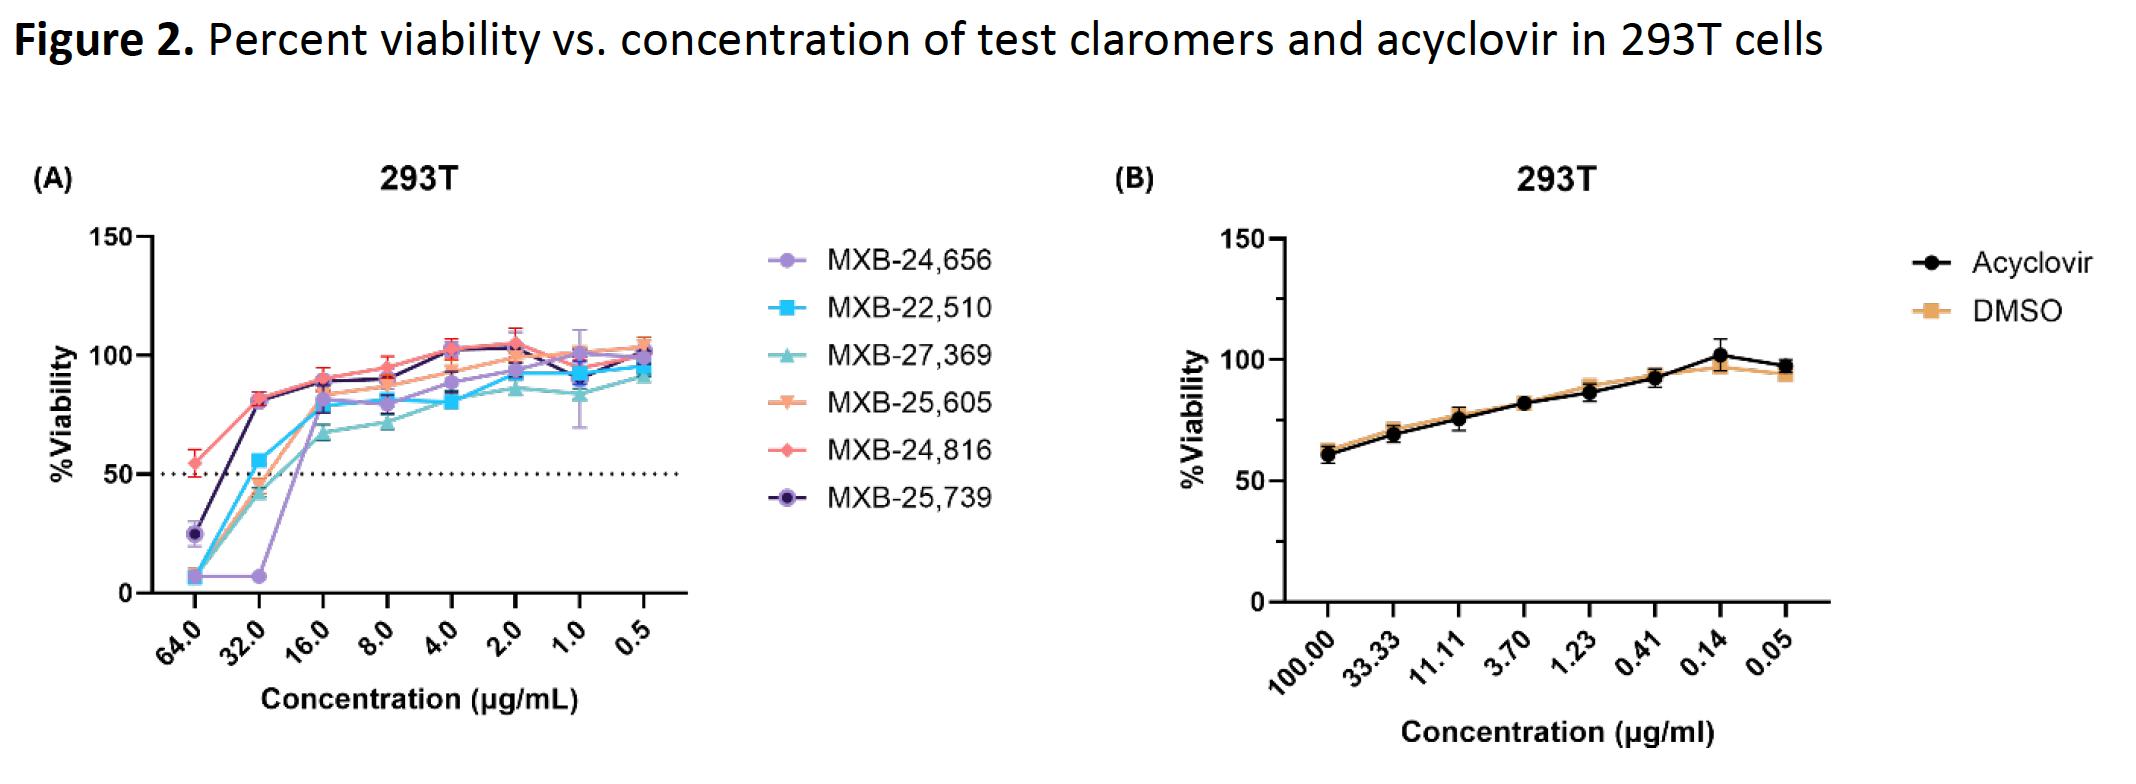
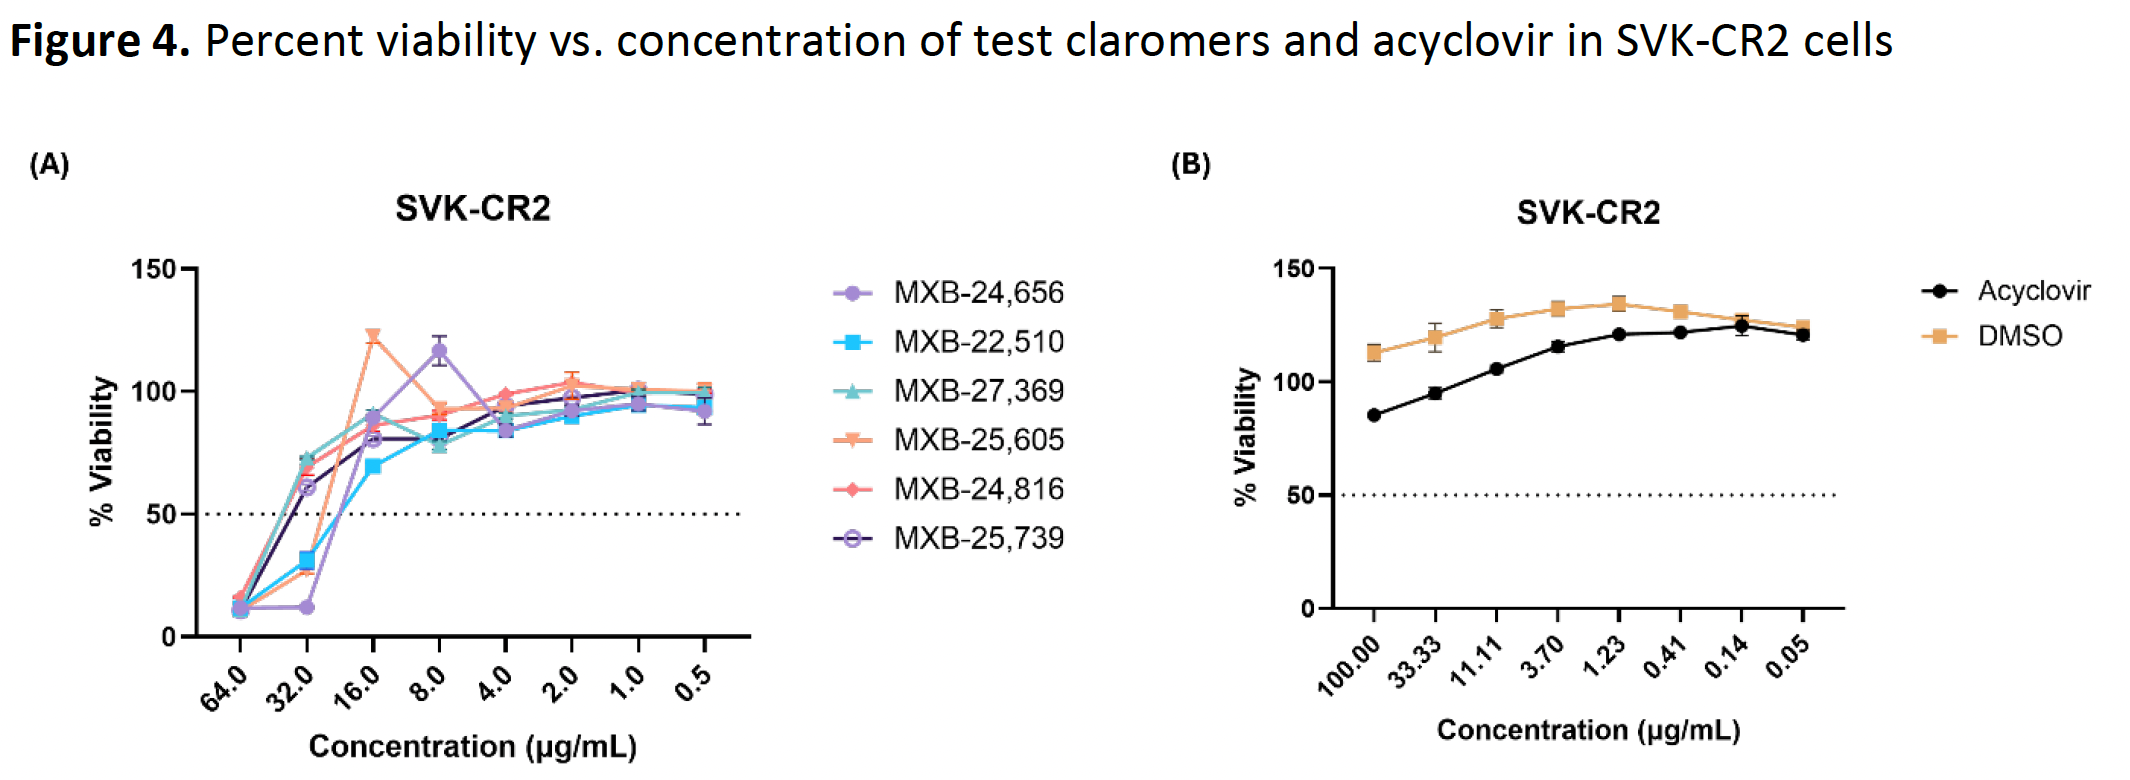
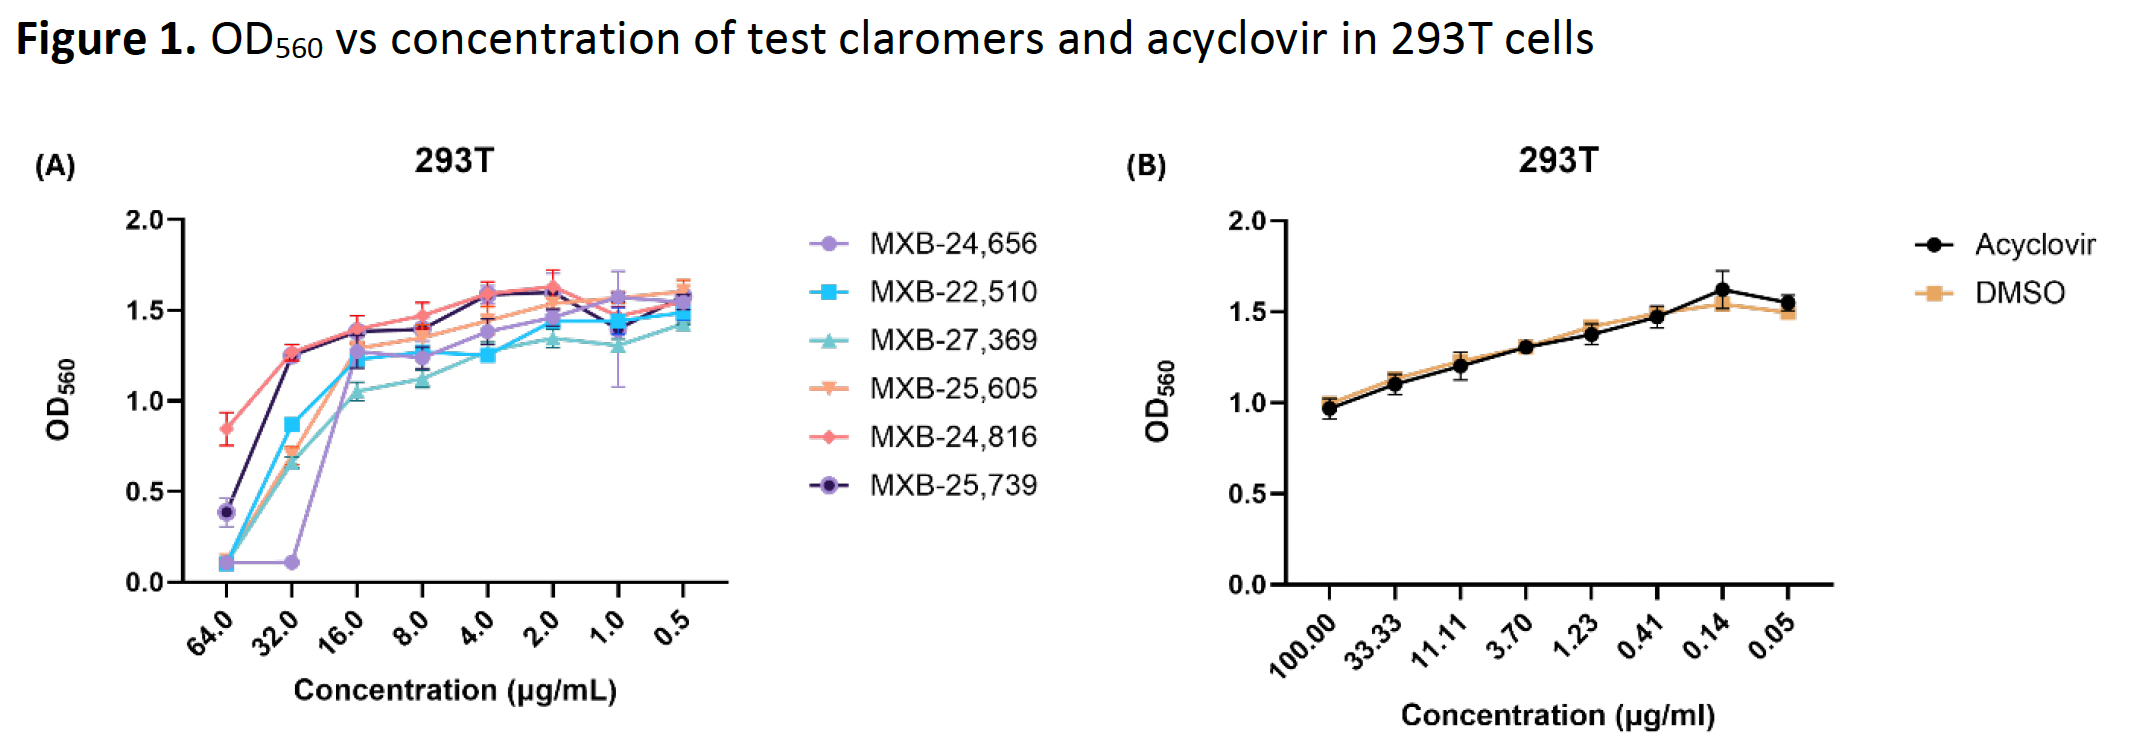
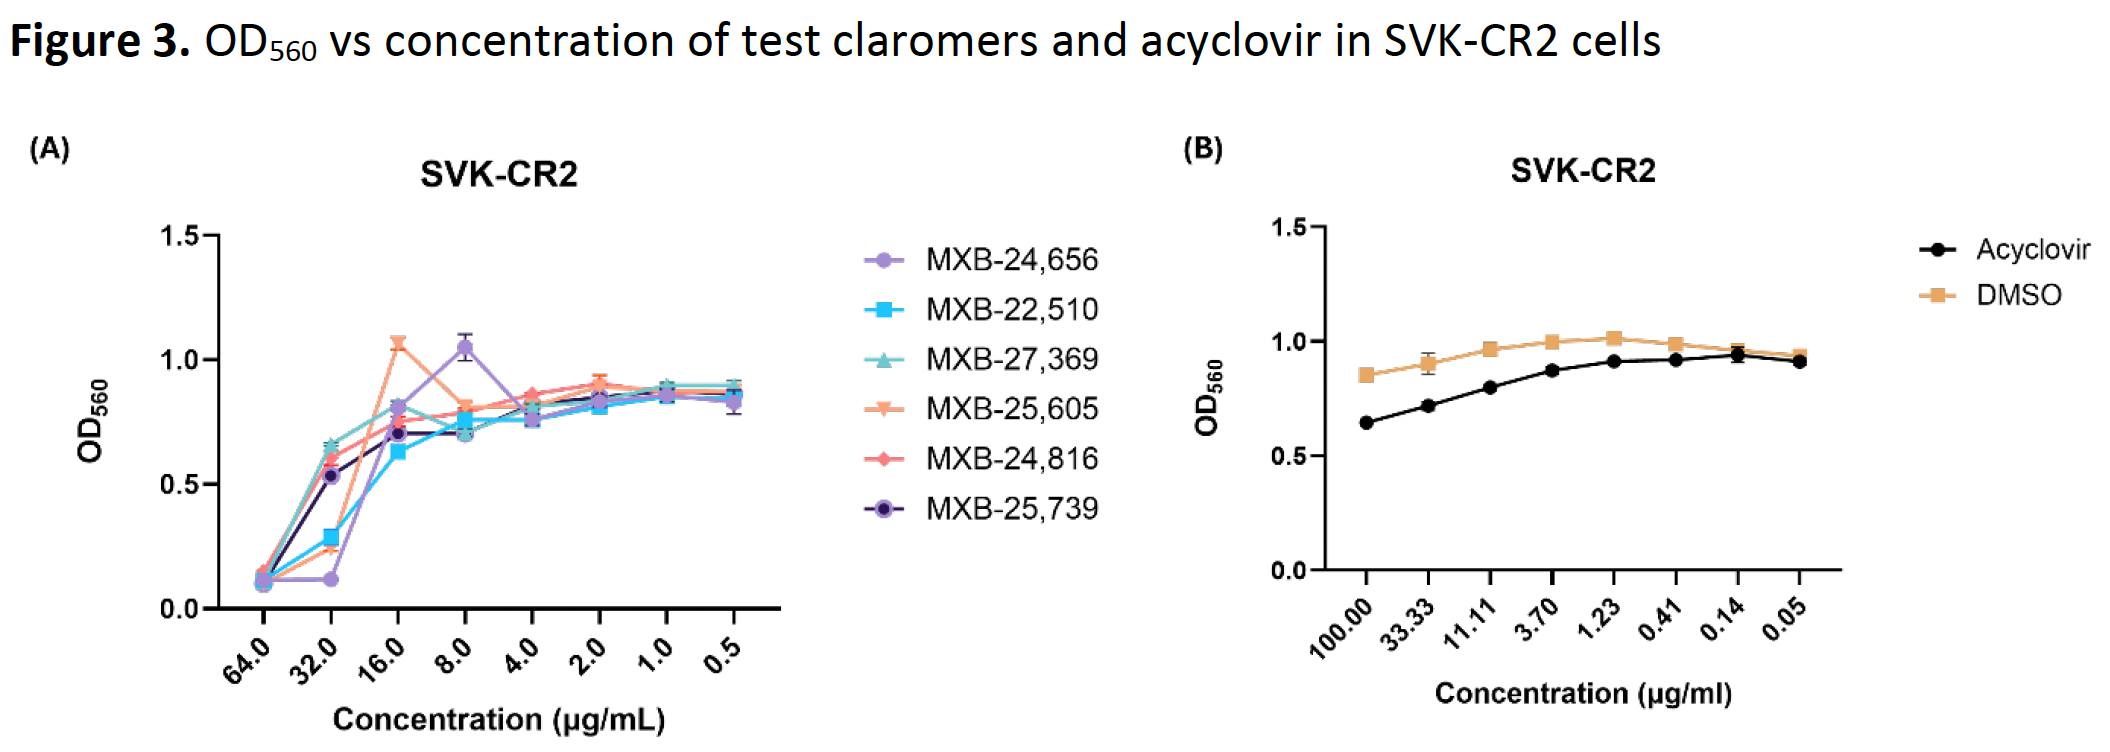
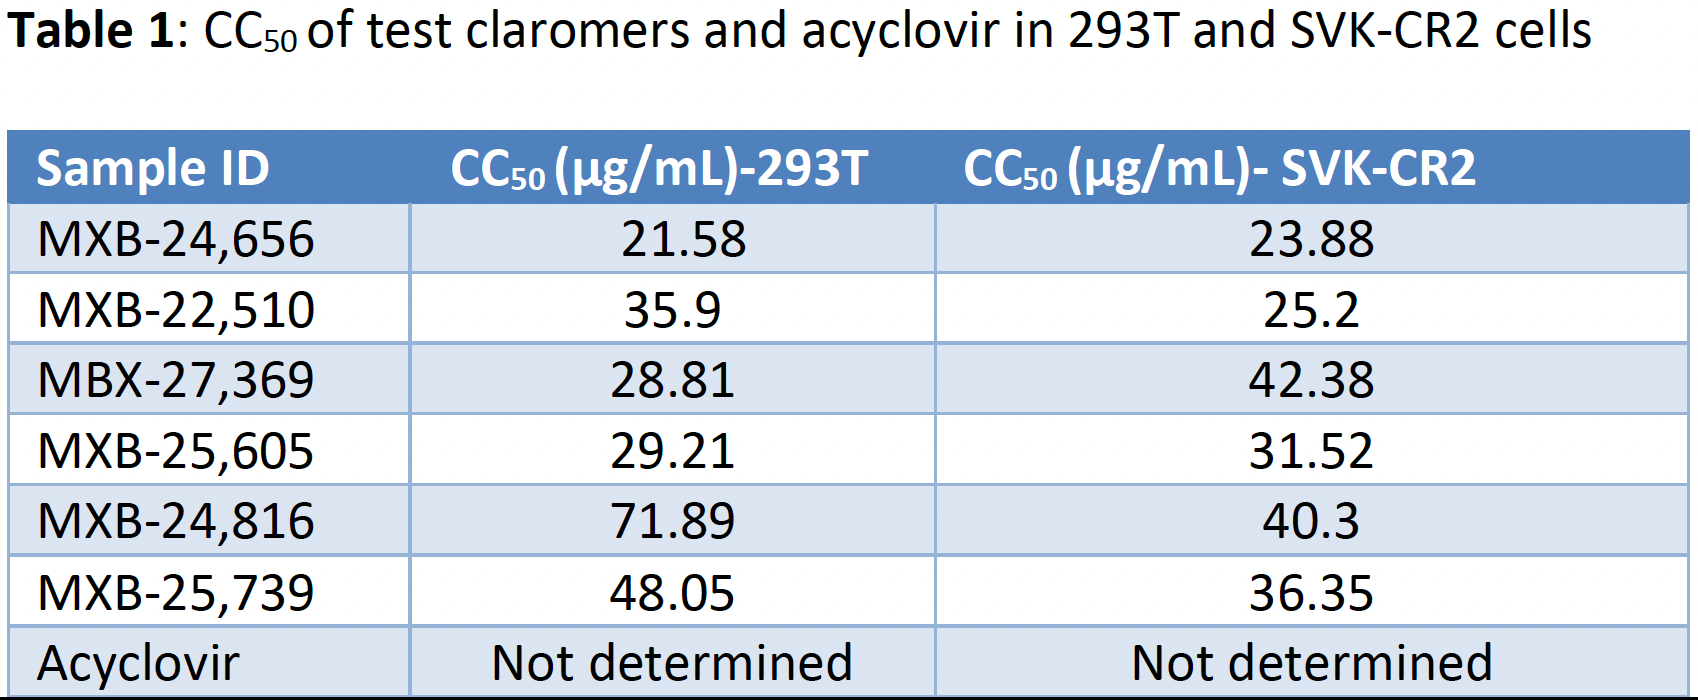
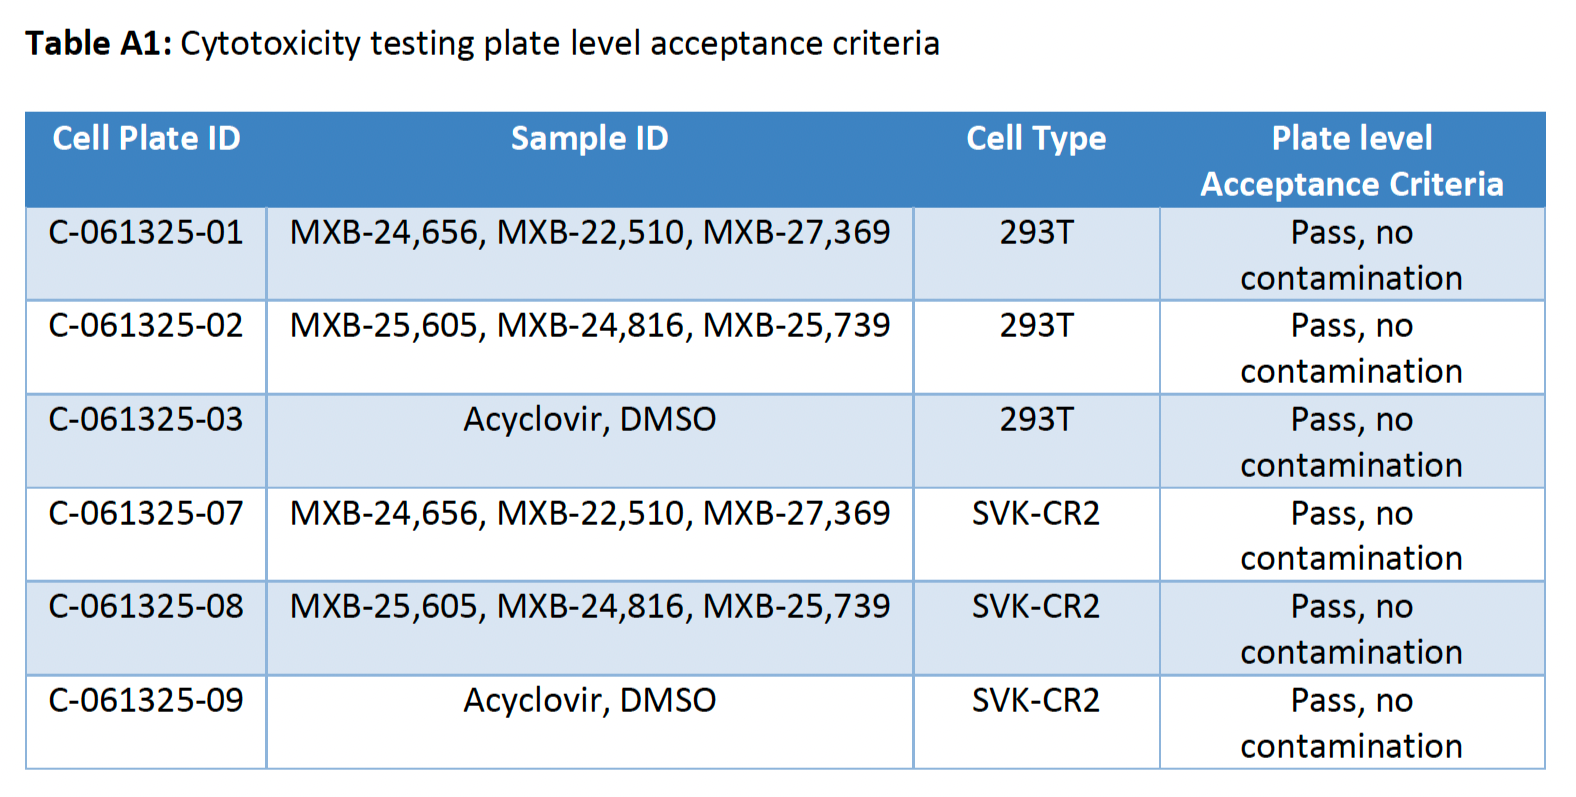
MTT assay was performed to evaluate the cytotoxic effects of the test Claromers®. All plates passed the plate level acceptance criteria (Table A1). Figures 1- 4 show the cytotoxicity results for test Claromers (A) and acyclovir and DMSO (B) in 293T and SVK-CR2 cells. OD560 versus Claromer concentration plots and the normalized % viability data versus concentration plots were used to represent the cytotoxicity of these test Claromers in 293T (Figure 1 and 2) and SVK-CR2 cells (Figure 3 and 4). CC50 values of all the test Claromers in 293T and SVK-CR2 cells were calculated and reported in Table 1.
Conclusions
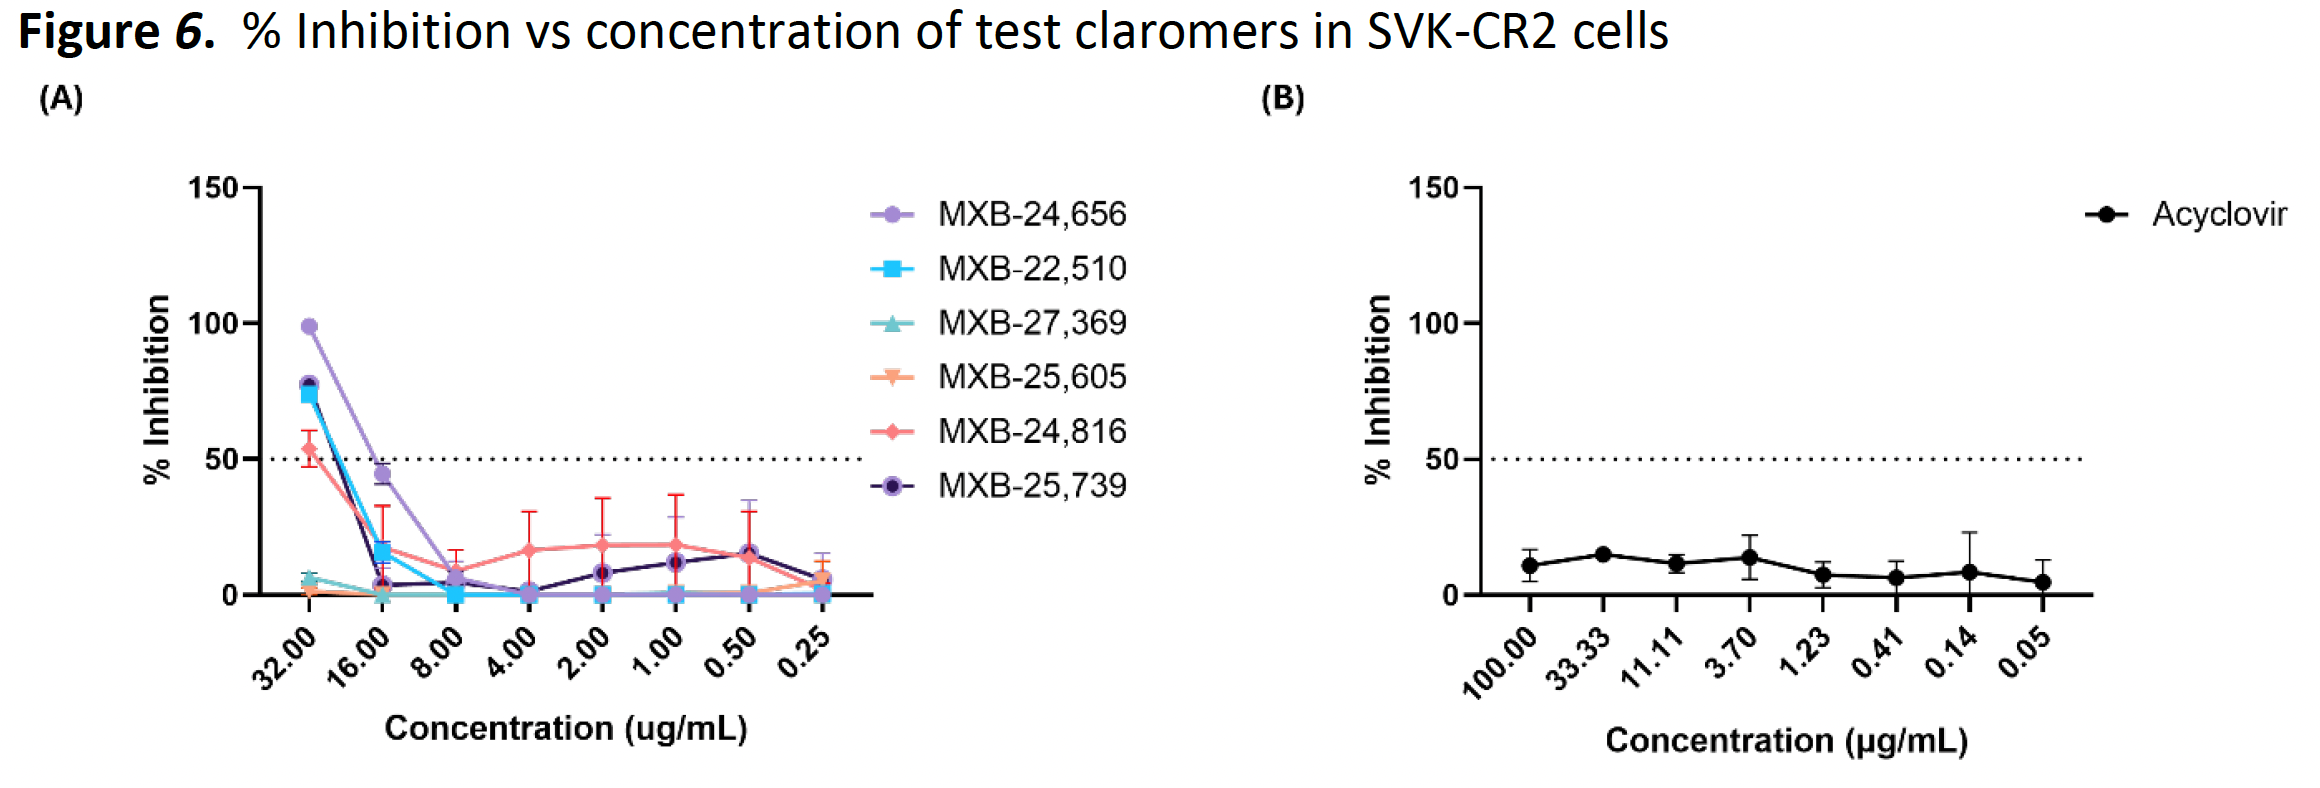
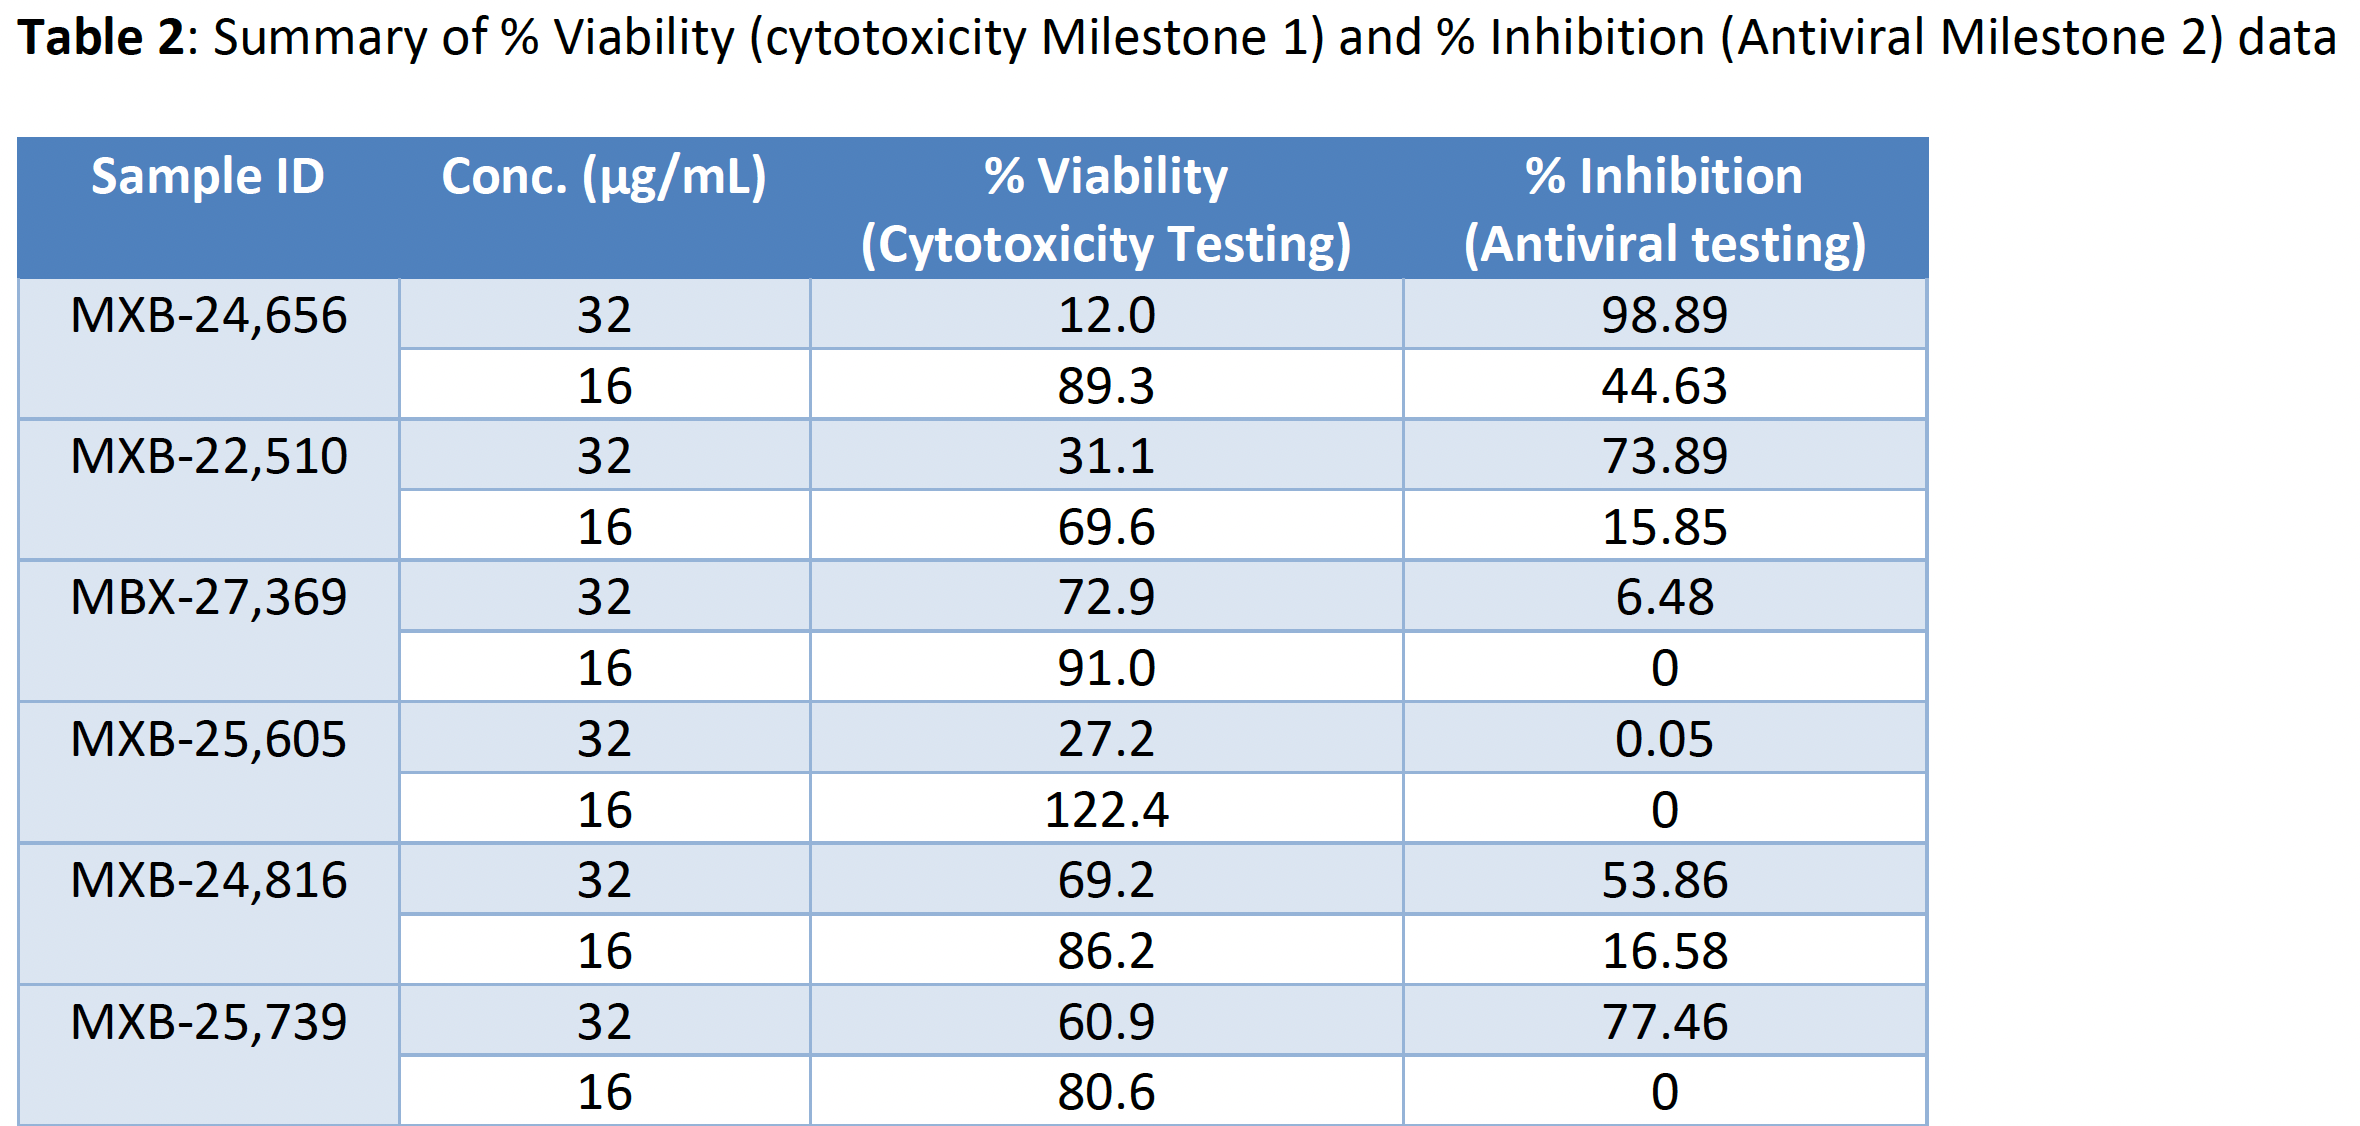
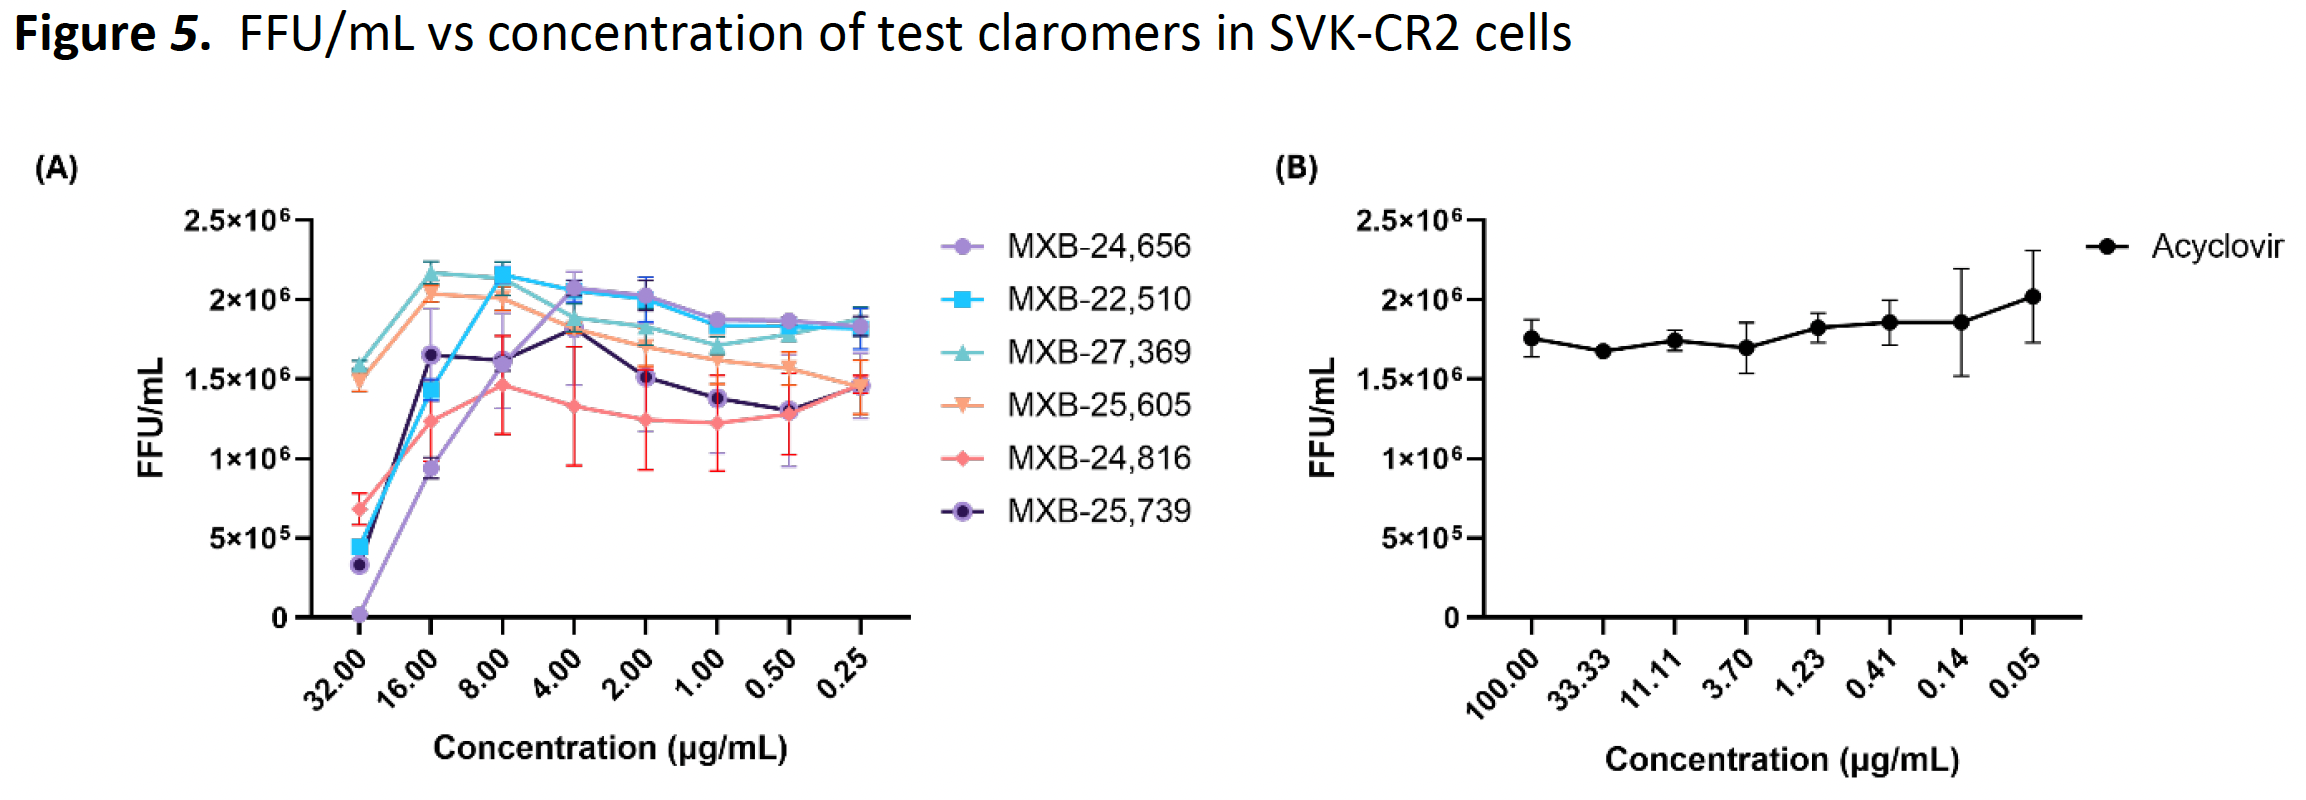
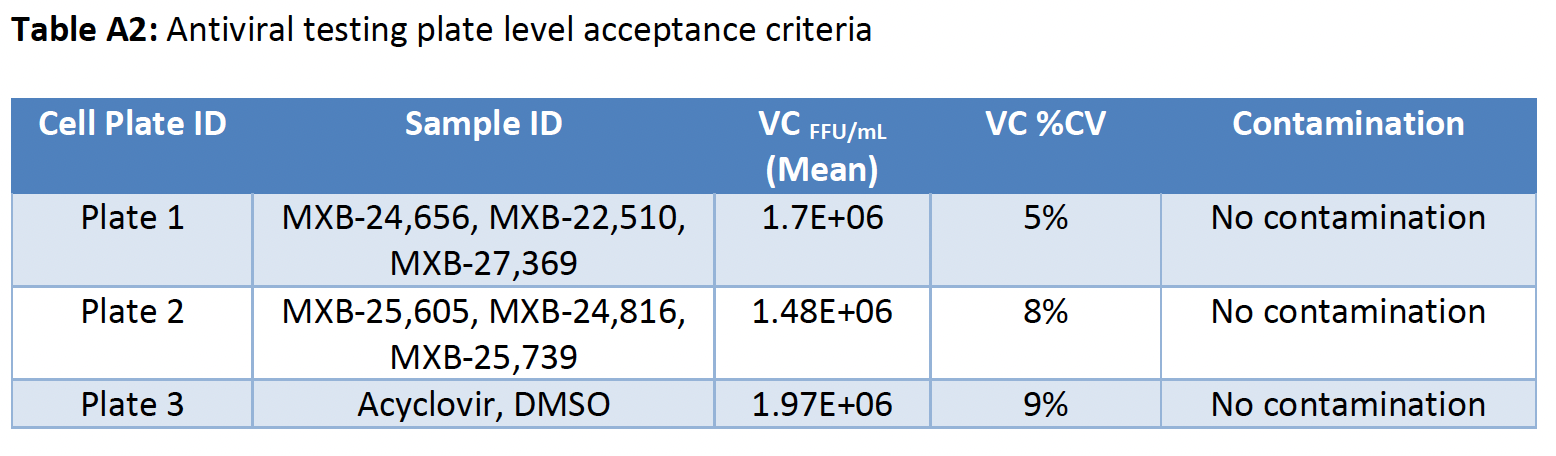
FFA-based antiviral testing was performed in SVK-CR2 cells to evaluate the inhibitory effect of test Claromers on EBV-GFP replication. Plate-level acceptance criteria were met for all plates (Table A2). Figure 5 shows the change in viral replication (FFU/mL) vs test Claromer concentration. Figure 6 illustrates the percent inhibition of EBV-GFP replication vs Claromer concentration. An IC50 value was not generated for any of the test Claromers due to the absence of a complete linear inhibition range with the Claromer concentrations used. Therefore, a comparative analysis was performed for the % inhibition values observed at the two highest testing concentration against the % viability data to assess the antiviral effects (Table 2).
Cytotoxicity Testing
293T cells –
MXB-24, 656, MXB-27,369 and MXB-25,605 - CC50 <32 μg/mL
MXB-22,510 and MXB-25,739 - CC50 < 64ug/ml.
MXB-24,816 - CC50 > 64ug/ml.
SVK-CR2 cells –
MXB-24,656, MXB-22,510 and MXB-25,605 - CC50 < 32ug/ml
MXB-27,369, MXB-24,816, and MXB-25,739 - CC50 < 64ug/ml.
Acyclovir treatment did not induce any significant cytotoxicity in either 293T or SVK-CR2 cells.
Antiviral Testing
SVK-CR2 cells –
MXB-24,816 and MXB-25,739 - >50% inhibition of the EBV-GFP infection at 32 μg/mL (CC50 >32 μg/mL).
MXB-24,656 and MXB-22,510 - >50% inhibition of the EBV-GFP infection at 32 μg/mL (CC50 <32 μg/mL).
MXB-27, 369 and MXB-25, 605 did not show significant inhibition at the tested concentration range.
Acyclovir treatment was not cytotoxic but did not show any inhibition against EBV in SVK-CR2 cells at the concentrations tested.